Heatmap Plots
Daily aggregated data heatmaps with rows = dates and columns = sites. Colour encodes the parameter value, revealing spatial and temporal patterns simultaneously.
5 plots — click any image to expand
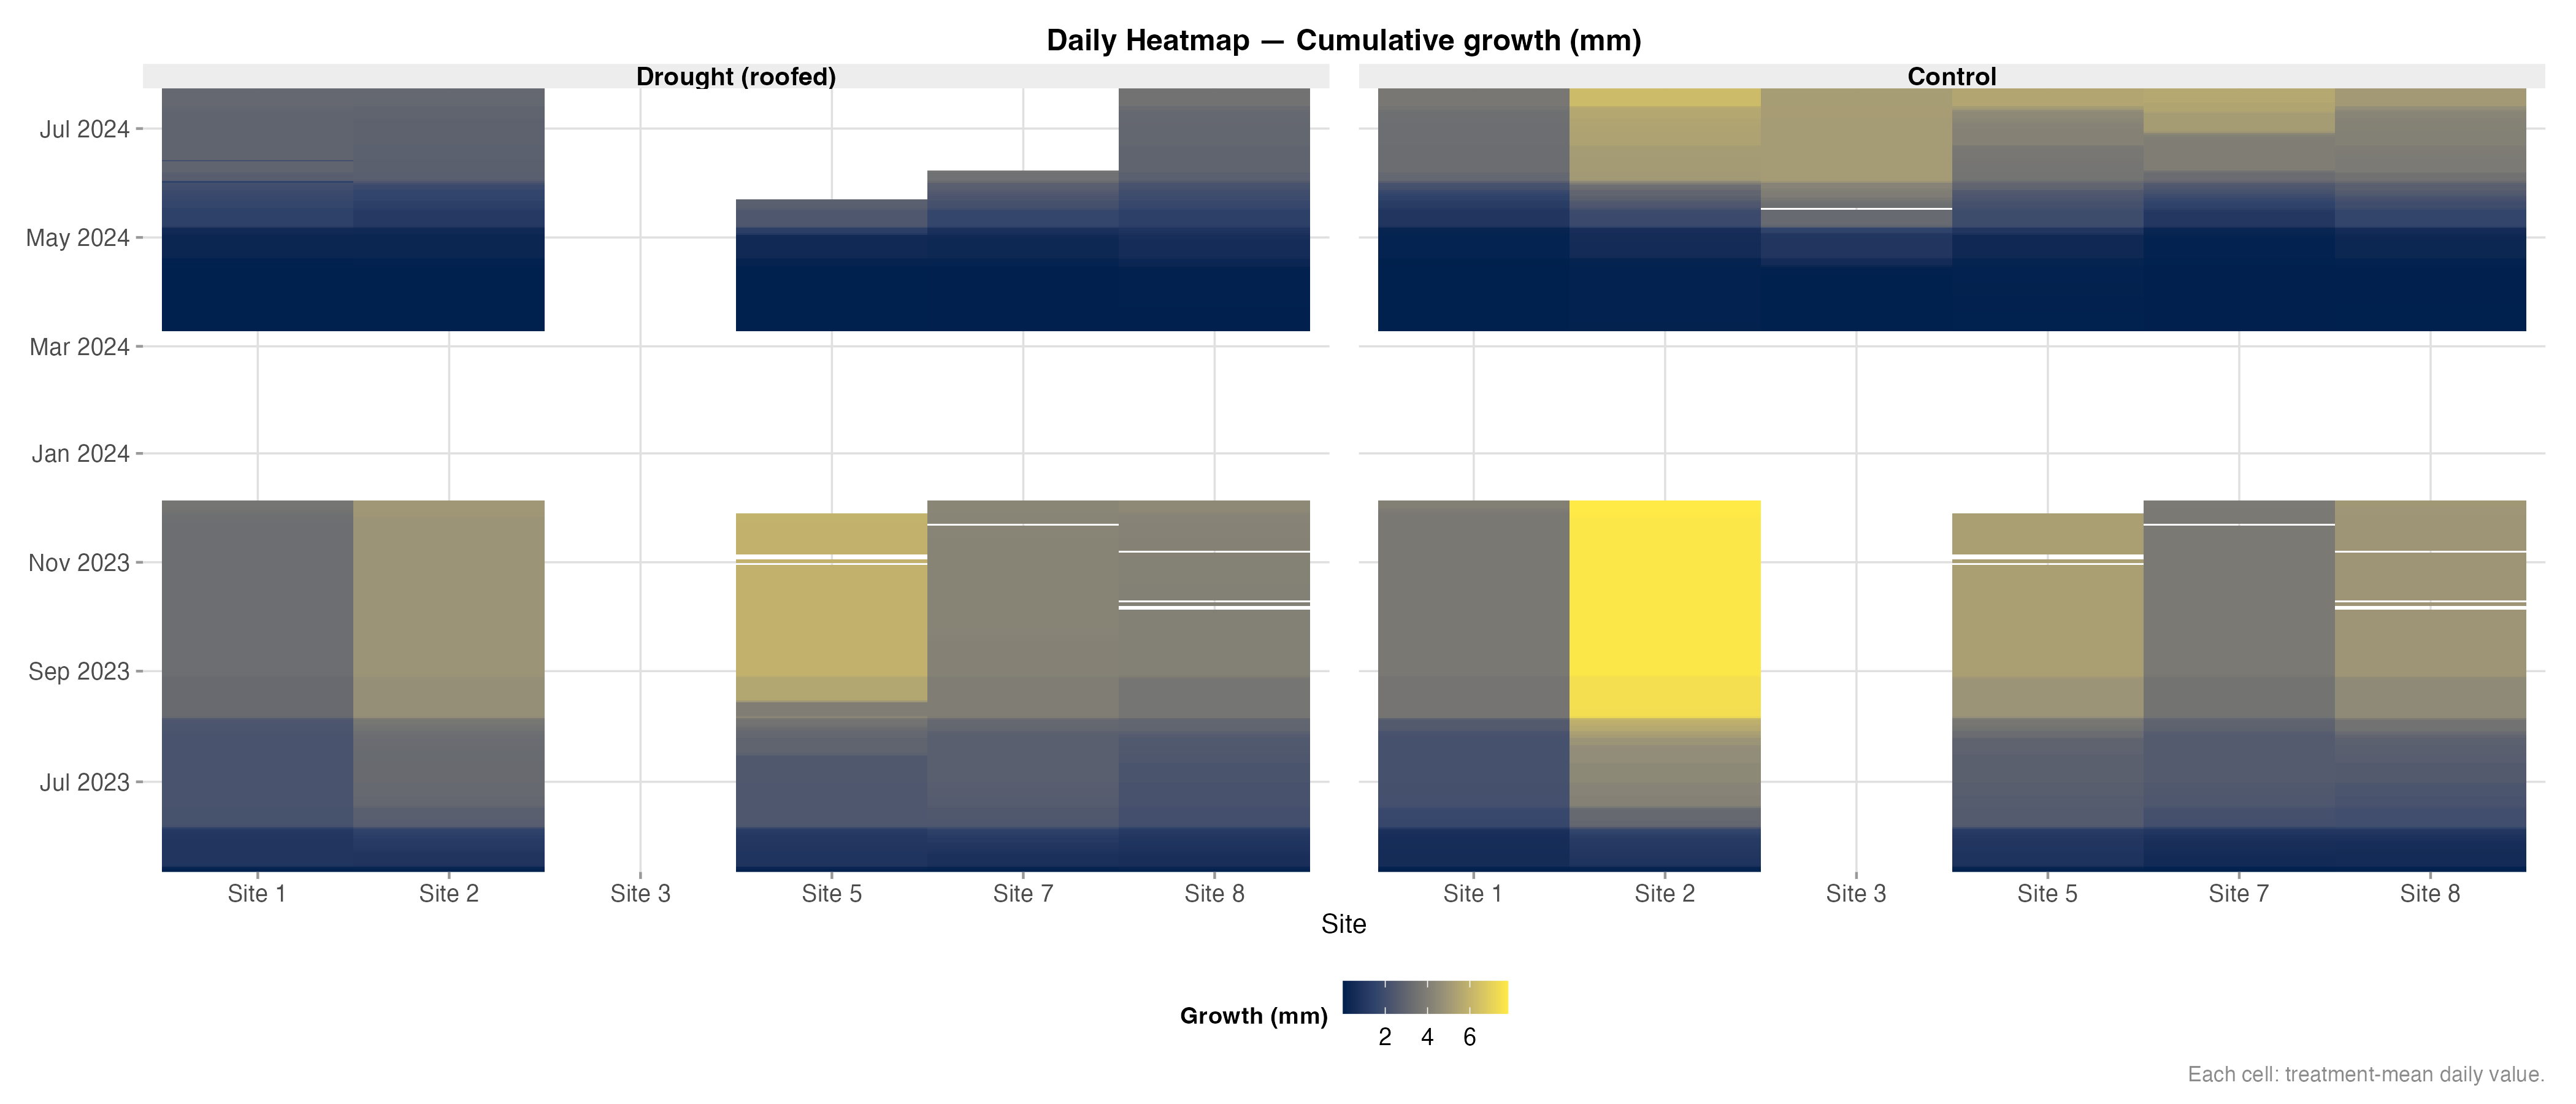
Heatmap – Increment
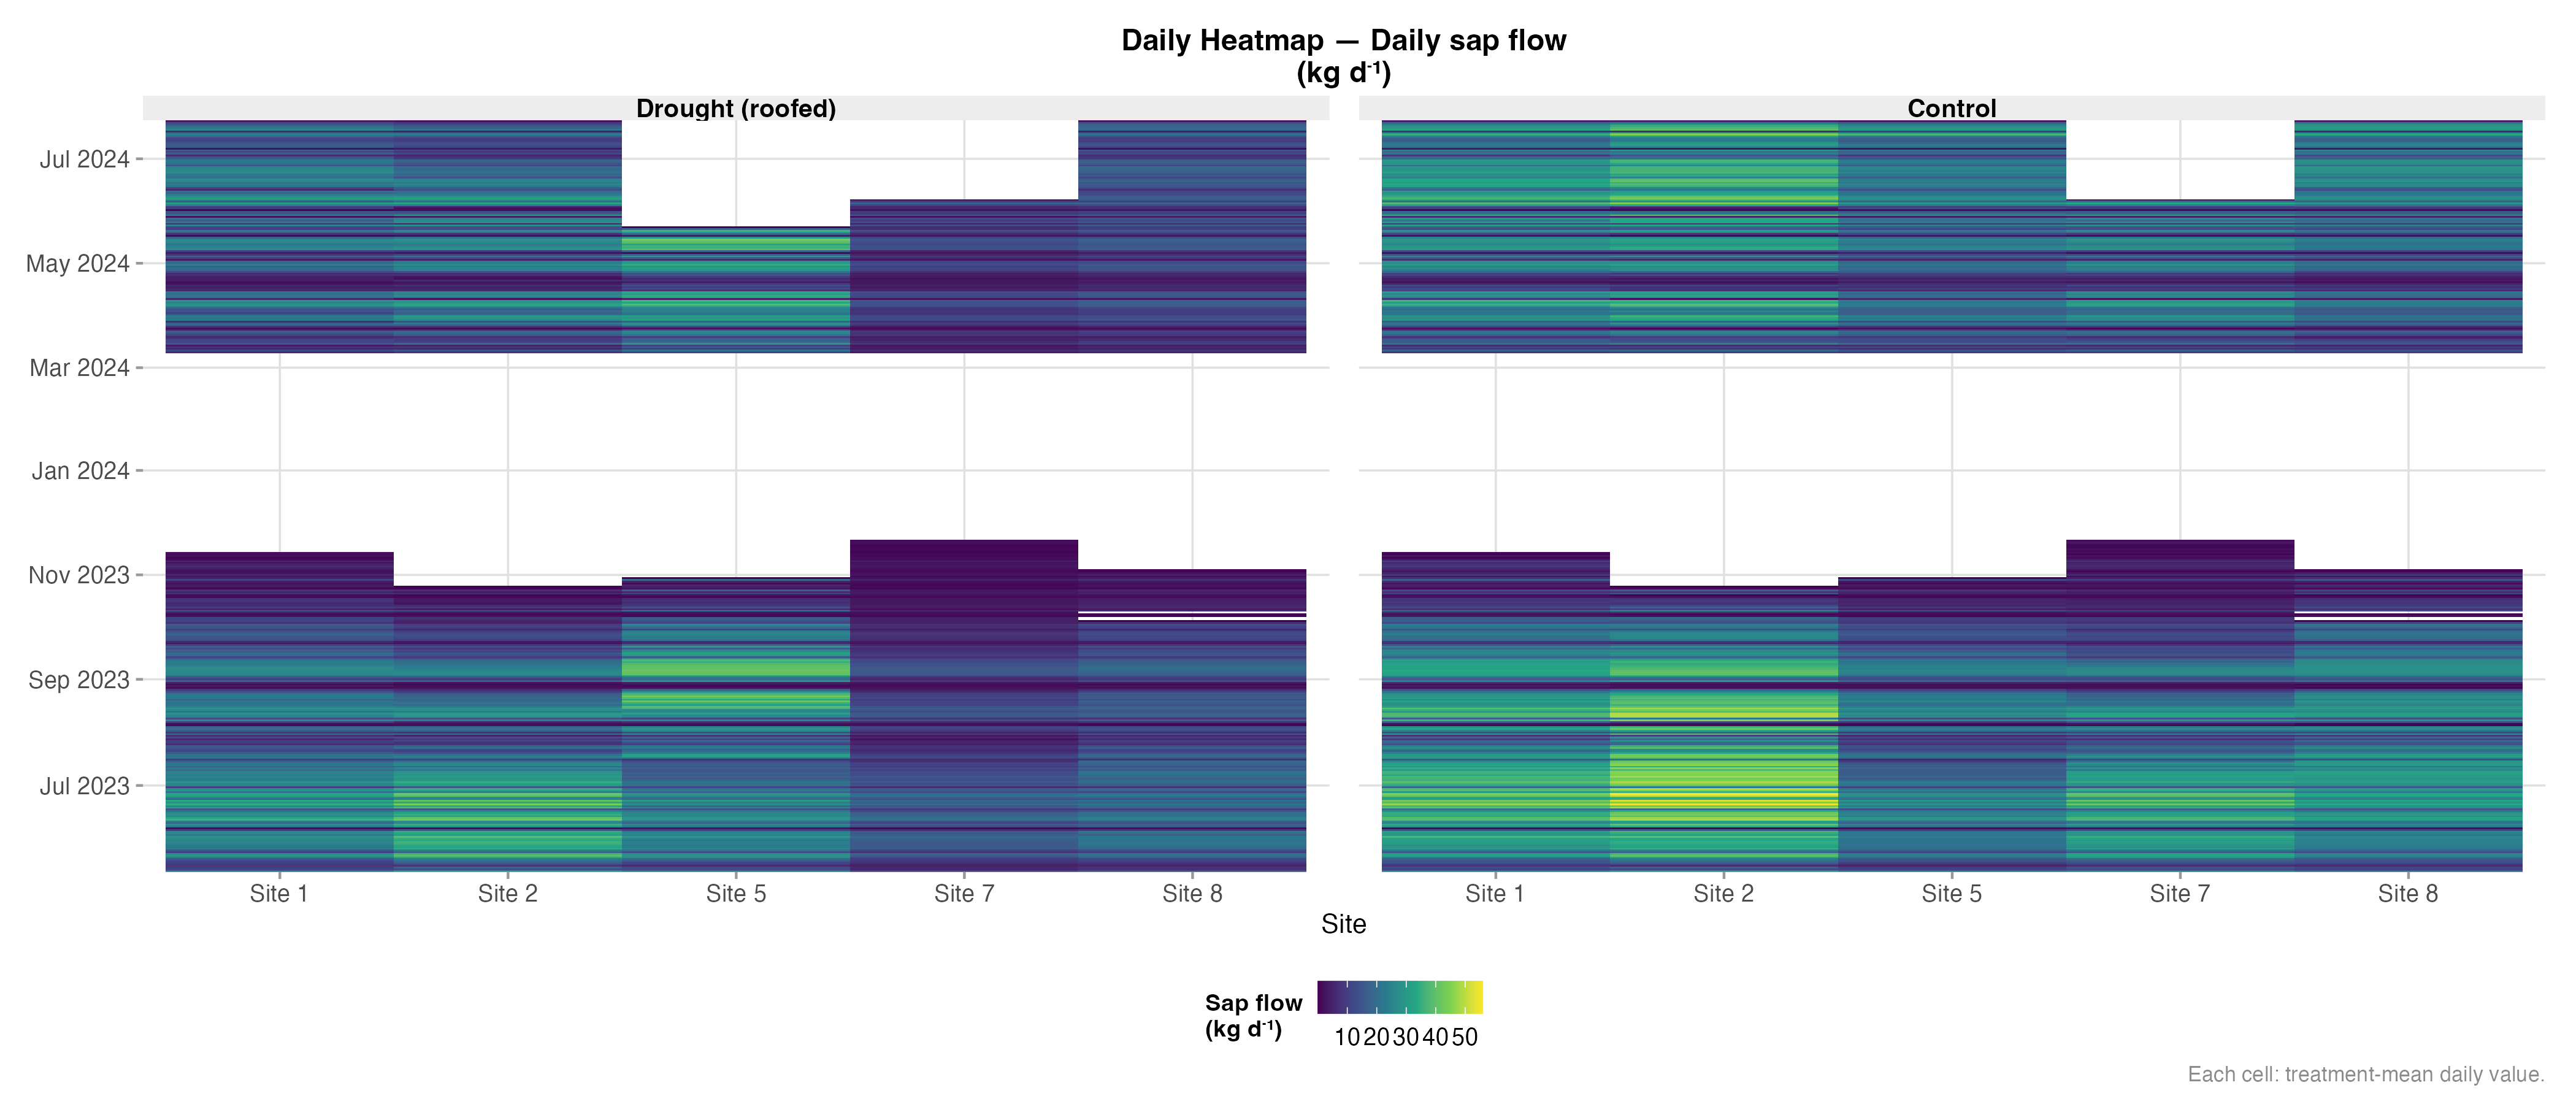
Heatmap – Sap Flow
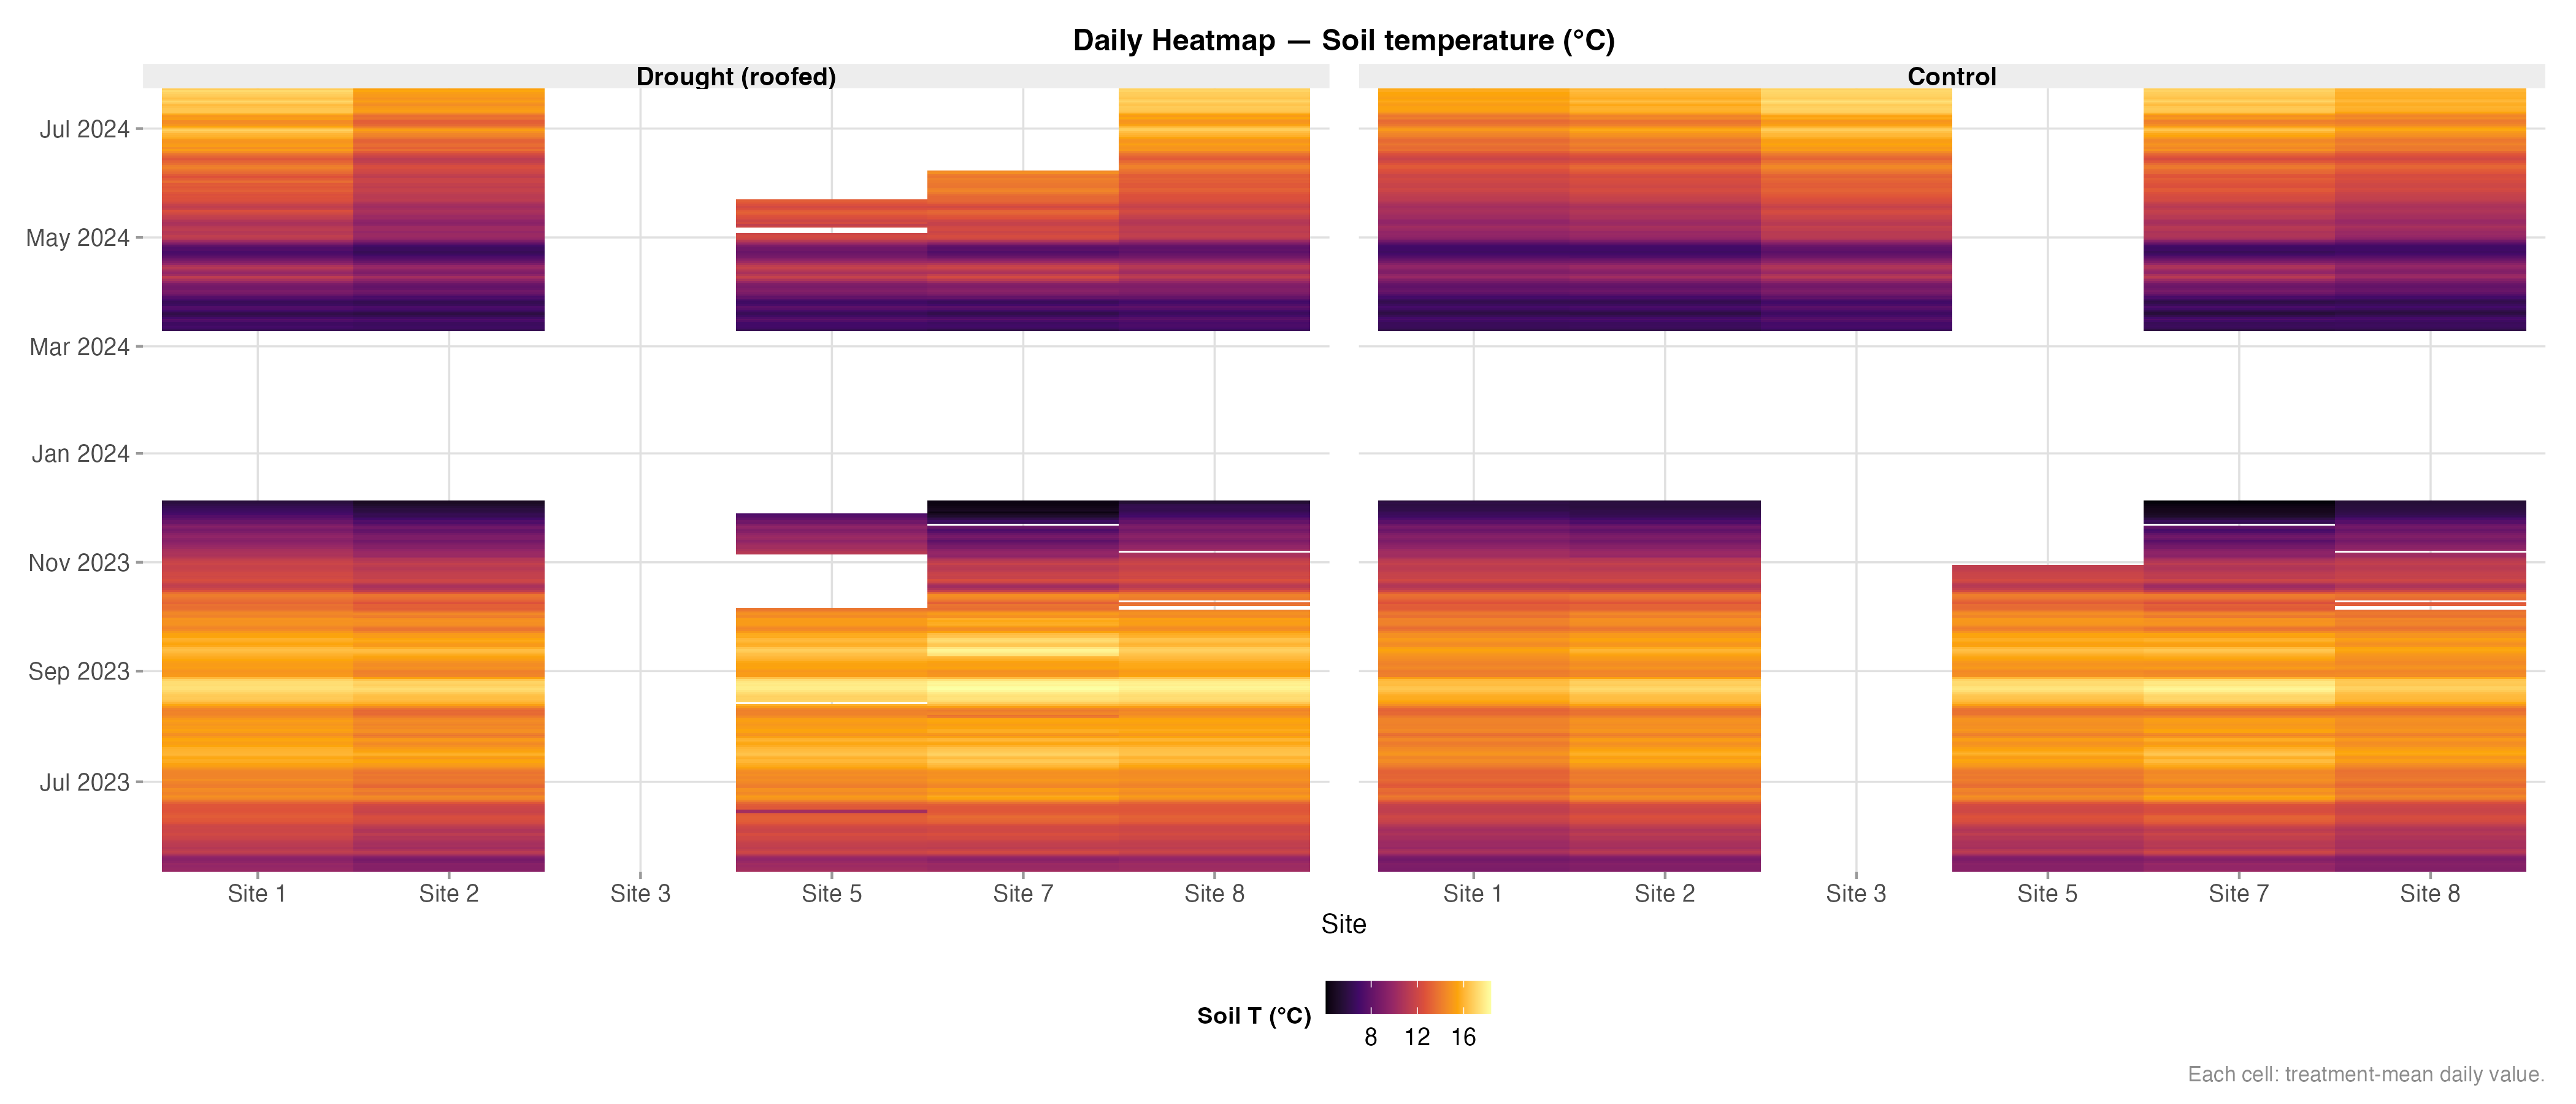
Heatmap – Soil Temperature
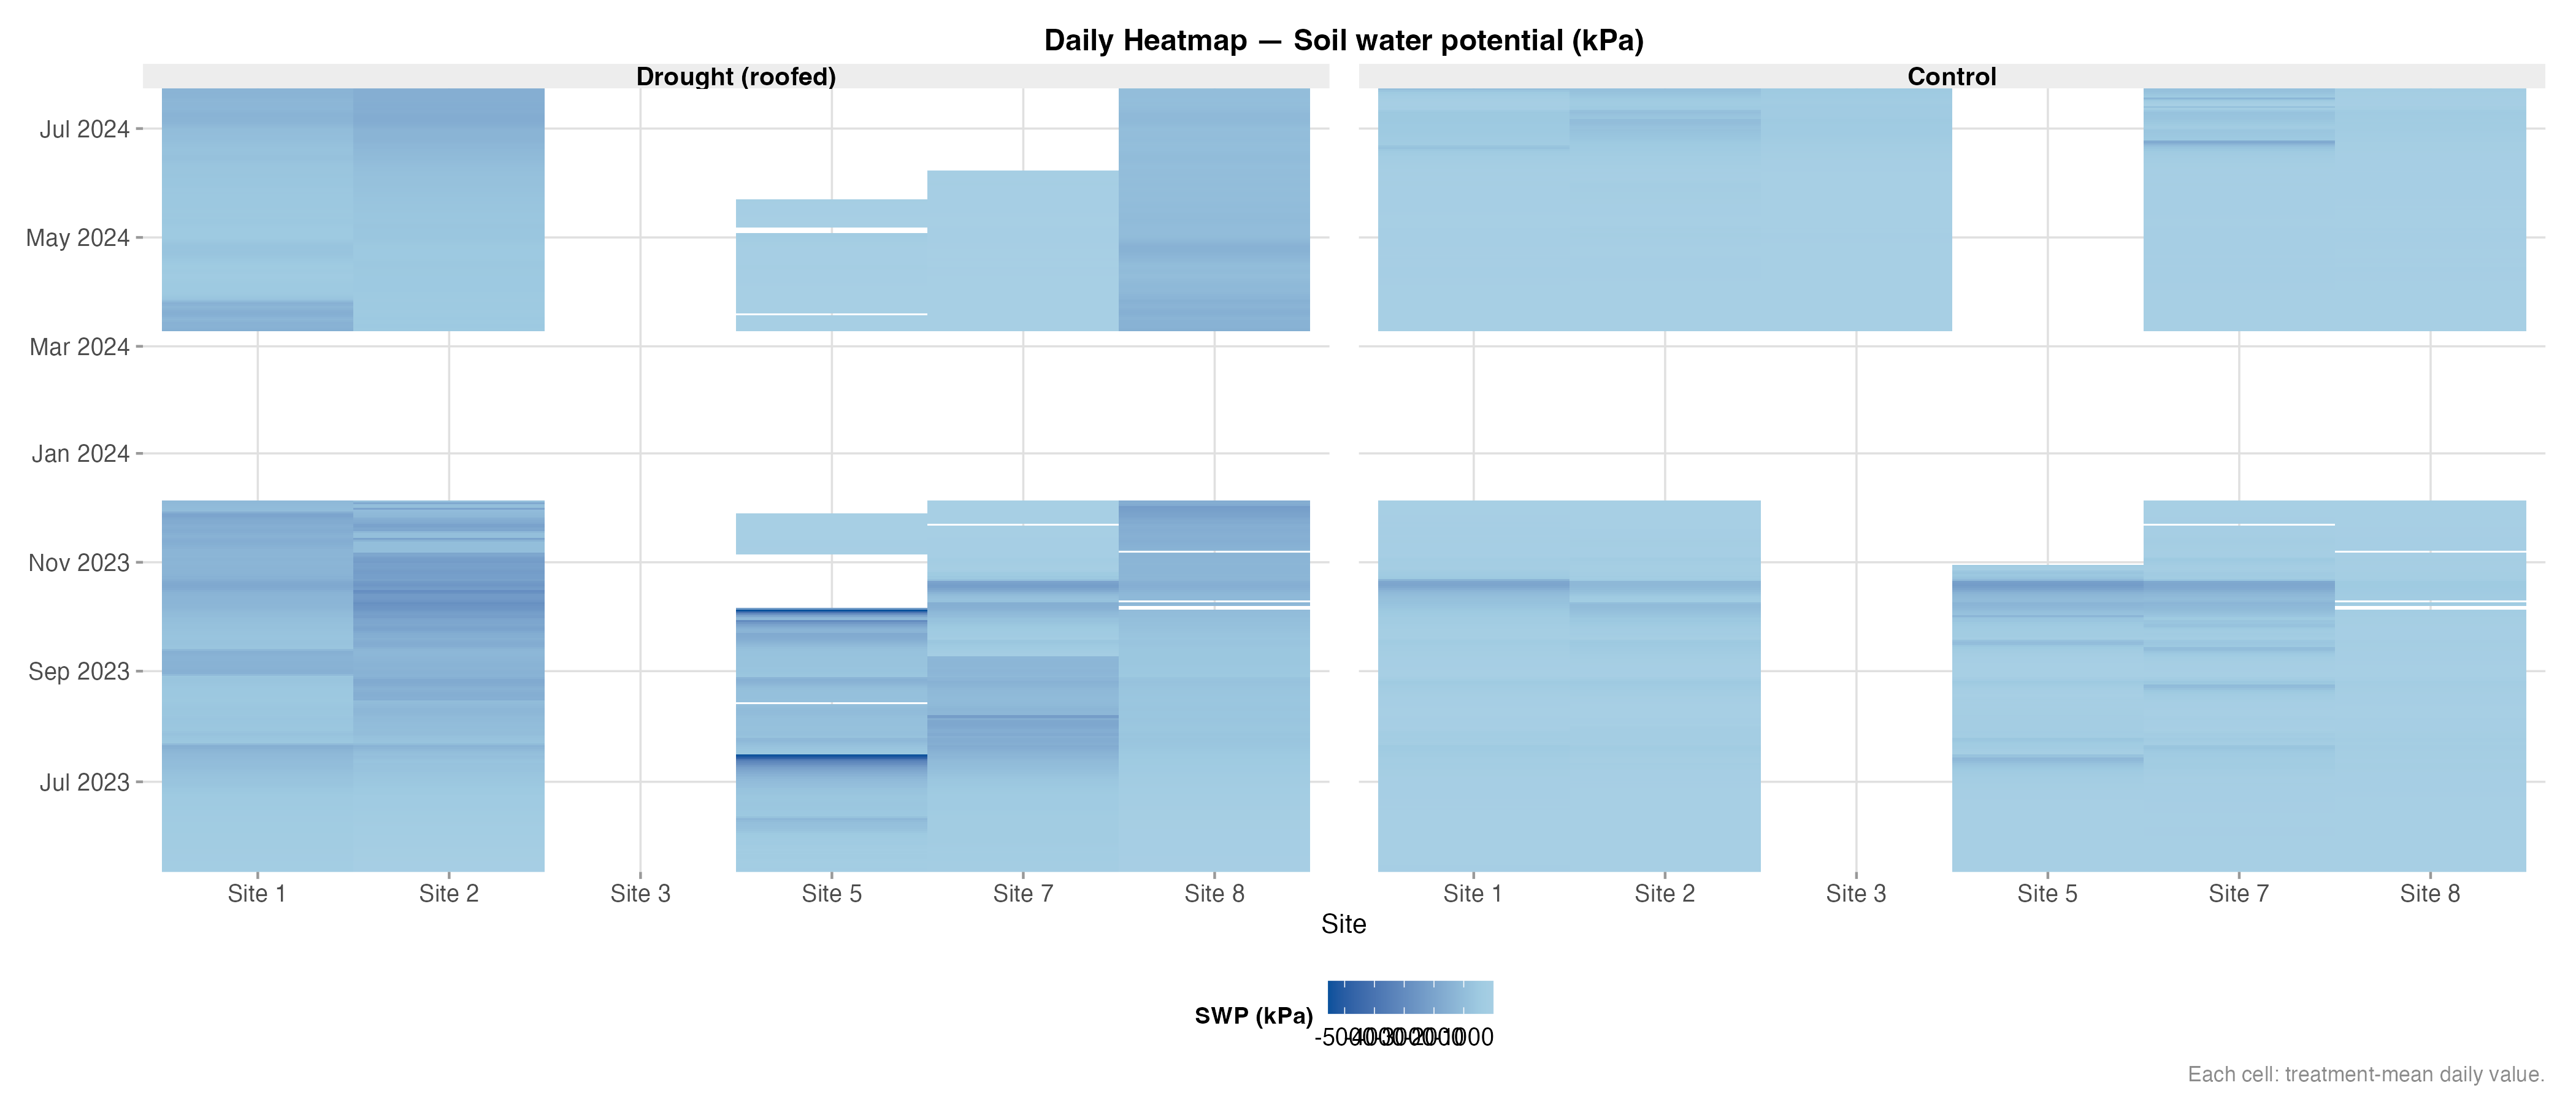
Heatmap – Soil Water Potential (SWP)
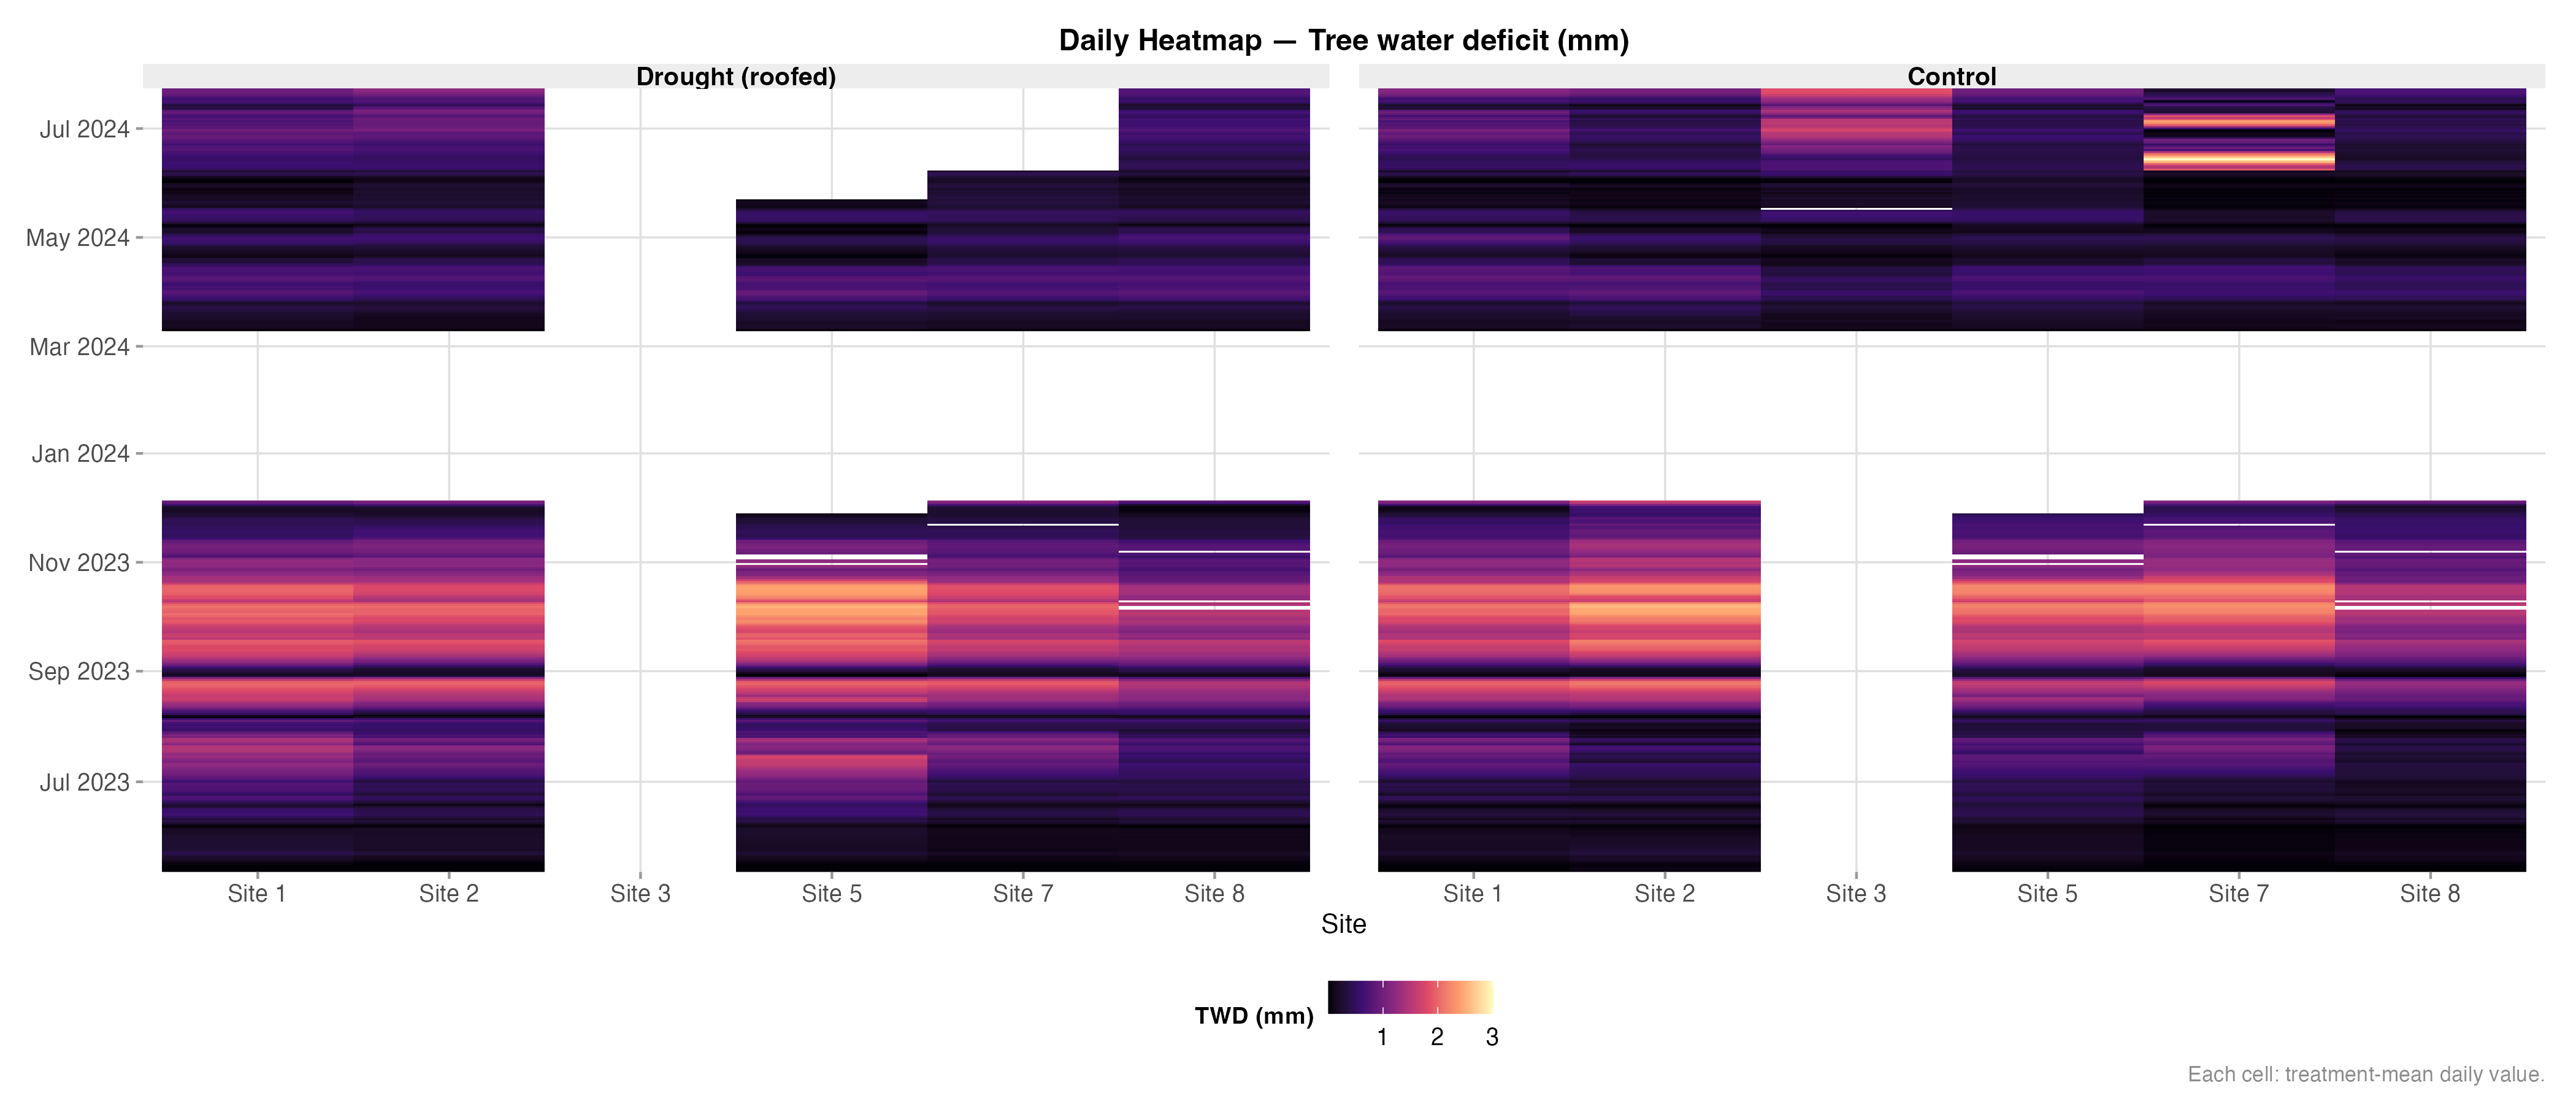
Heatmap – Tree Water Deficit (TWD)